Most small plants manage every purchased part the same way: someone notices it's low and orders more. That works until it doesn't, and when it fails it fails in both directions at once: shortages on the parts that matter and too much cash tied up in the ones that don't.
A simple two-way classification, ABC by value and XYZ by predictability, fixes a surprising amount of this. It takes a spreadsheet and an afternoon, and it gives buyers and planners a clear rule for every part.
ABC: where the money is
Rank every purchased item by its annual spend (usage times unit cost), highest first, and add up the running total.
- A items are the small group at the top that makes up most of the spend, typically around 80%.
- B items are the next tier, roughly the next 15%.
- C items are the long tail: most of the item count, very little of the money.
The cutoffs aren't sacred. What matters is that A items deserve close management, and C items deserve as little management effort as possible.
XYZ: how predictable the demand is
Now look at each item's usage over the last 12 months, month by month, and measure how much it varies. The usual measure is the coefficient of variation: the standard deviation of monthly usage divided by the average.
- X items have steady, predictable demand.
- Y items vary but follow a pattern, such as seasonality or trends.
- Z items are erratic: long stretches of nothing, then a spike.
Again, the exact thresholds matter less than applying them consistently.
Putting them together
Crossing the two gives nine groups, and each one suggests a different way to manage the part.
To read the grid, find a part's row by its value (A, B or C) and its column by how steady its demand is (X, Y or Z). The cell gives the default rule for managing it. The four highlighted corners are where the rule is clearest and where most plants find their biggest gains: tight supplier agreements for steady, expensive parts, full automation for steady, cheap ones, and deliberate decisions for the erratic ones at both ends.
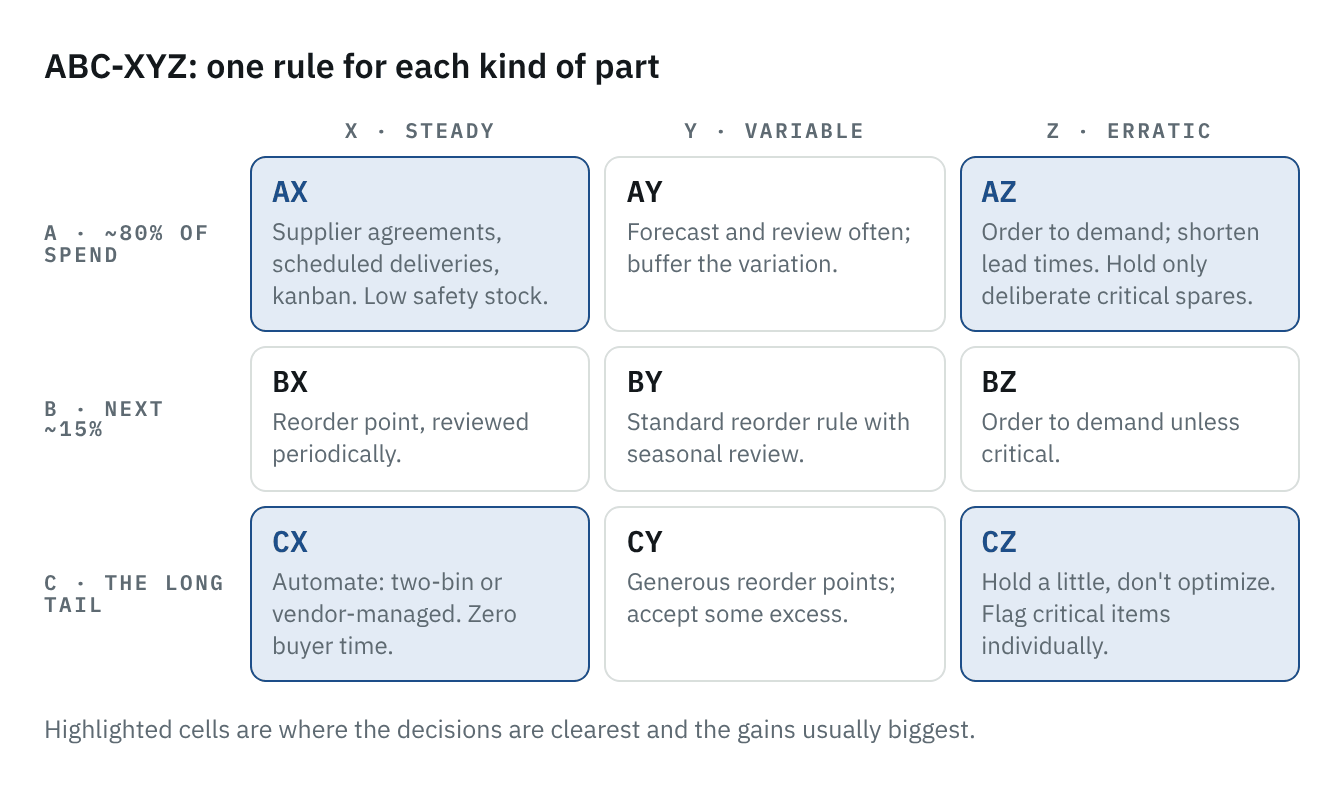
AX and BX: high or medium value, steady demand. Manage tightly. These are the parts for supplier agreements, scheduled deliveries, consignment or kanban. Keep low safety stock, because demand is predictable.
AZ: high value, erratic demand. Don't stock these on habit. Order to demand where lead times allow, and invest buyer time in shortening those lead times. Where an AZ item is also critical to keeping a machine running, make a deliberate decision to hold one, and write down why.
CX: low value, steady demand. Automate completely. Two-bin systems, vendor-managed inventory or generous reorder points. The goal is zero buyer time.
CZ: low value, erratic demand. Usually the largest group by count. Hold a little, accept some excess, and don't spend time optimizing. If something in this group is critical, flag it individually.
The B and Y middle gets a standard reorder rule, reviewed periodically.
What changes when you do this
The immediate effect is clarity about where buyer time goes. Instead of reacting to whatever ran out yesterday, buyers spend their attention on the A items and the critical exceptions, and let rules handle the rest.
The second effect is cash. Plants that classify for the first time almost always find stock that doesn't fit any sensible rule: erratic, low-value parts bought in large quantities, or high-value parts sitting on the shelf for a demand that comes once every two years.
The third is a common language. When planning, purchasing and maintenance all describe a part the same way, "that's an AZ, we order it to demand," a lot of arguments get shorter.
The data problem
The classification is only as good as the usage data behind it. Two problems come up every time:
- Duplicate items. If the same part exists under three numbers, each looks like a low-volume C item when together it's a B or an A. Clean the item master first.
- Missing usage. Parts pulled from the shelf without being recorded don't show demand, so they look like Z items or disappear entirely. If issuing parts isn't recorded at the moment it happens, the analysis will mislead you.
Both problems are the same lesson as on the shop floor: the analysis is easy, and the hard part is capturing good data at the source, every time.
How to start
Export 12 months of purchase or usage history by item. Calculate annual spend and the monthly variation, assign ABC and XYZ, and look at the nine counts. Then pick the two corners with the biggest opportunity: usually the AX items for supplier agreements and the CZ items for clearing excess. A spreadsheet is enough for the first pass. Re-run it quarterly, and the rules will start to manage most of your parts for you.